


Today’s Crypto Brief: BTC Holds $80K as Market Digests Volatility
By Darren Smith
May 15, 2026
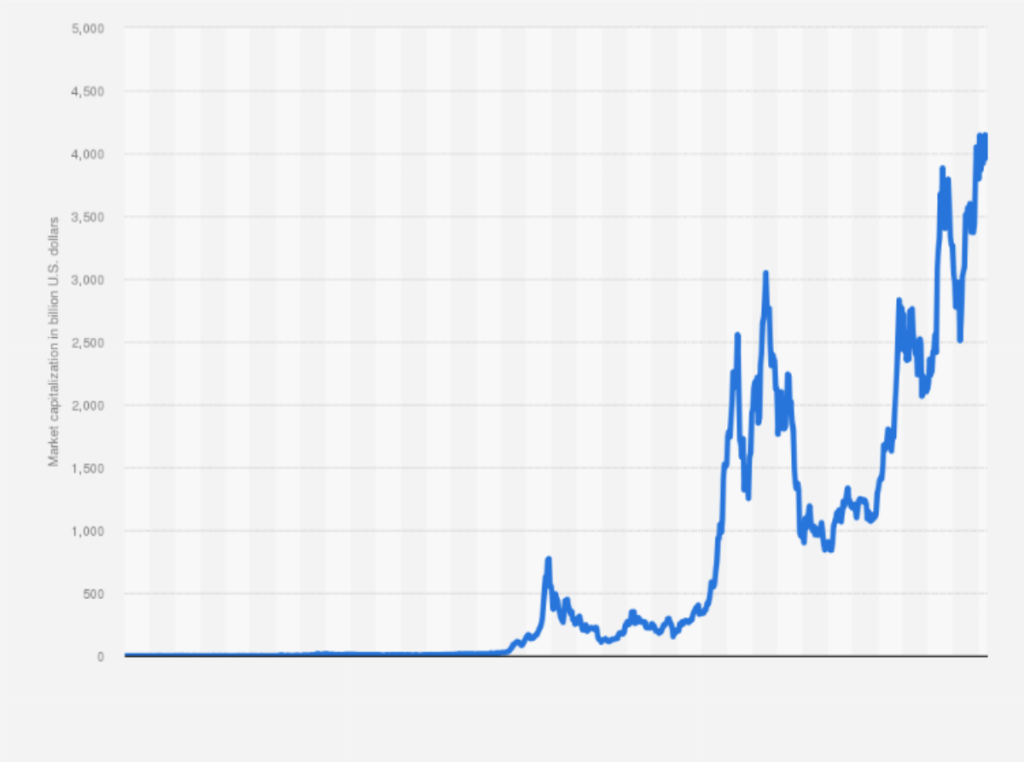
In a week marked by sharp ETF outflows, regulatory optimism from the CLARITY Act, and resilient institutional interest, the cryptocurrency market demonstrated remarkable stability on May 15, 2026. Bitcoin hovered near the psychologically critical $80,000–$81,000 level, while Ethereum consolidated around $2,250–$2,280. The total crypto market capitalization stood at approximately $2.76 trillion, reflecting a modest daily uptick amid broader economic uncertainty.
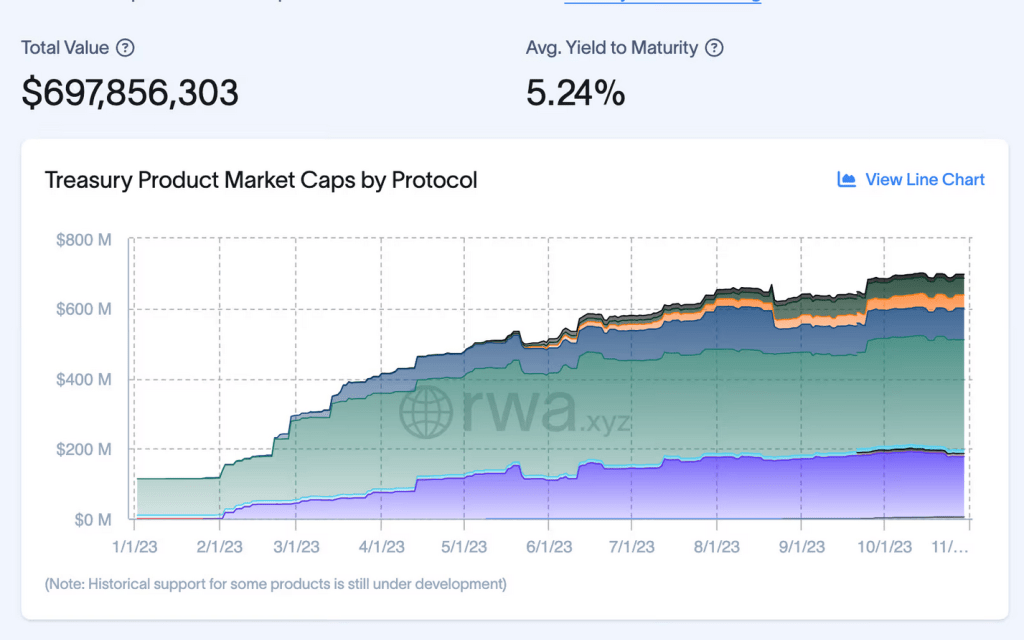
This performance underscores a maturing market less prone to knee-jerk reactions, even as traditional finance signals flash caution. Tokenized Treasuries surpassed $15 billion in value, signaling deepening integration between blockchain infrastructure and real-world assets.
Bitcoin’s Resilience in Focus
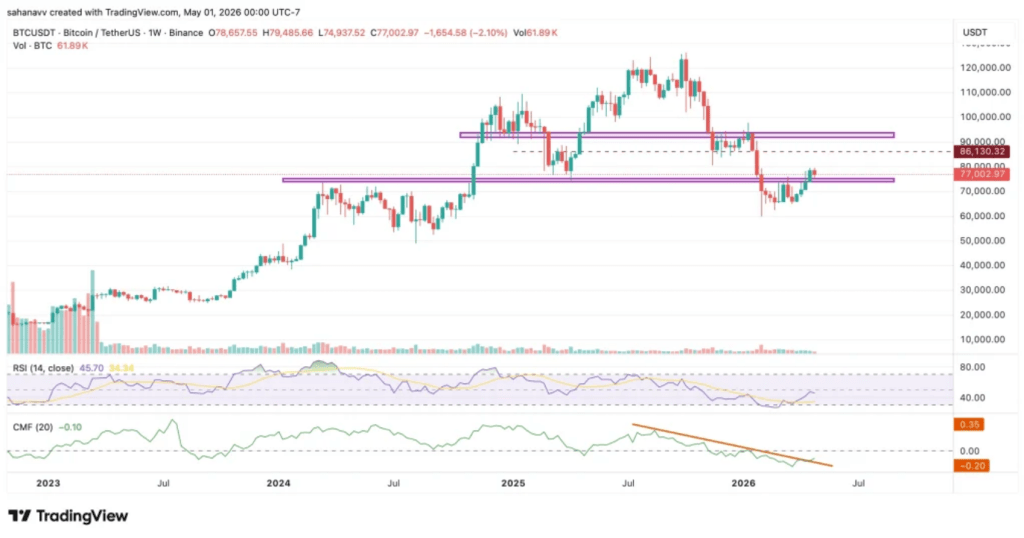
Bitcoin (BTC) opened the day near $81,069 before experiencing mild slippage to trade around $80,500–$80,900 mid-morning UTC. This follows a rebound from recent pressures caused by $635 million in Bitcoin spot ETF outflows on May 13 — the largest single-day exodus since January.
Despite the outflows, conviction buyers accumulated aggressively, with on-chain data showing strong long-term holder activity. Analysts attribute this to growing recognition of Bitcoin as a strategic reserve asset.
Technical analysts highlight Bitcoin’s position above its 200-day simple moving average as a key support zone. The asset has been trading within a rising channel, facing resistance near $82,300. A decisive break above this level could propel prices toward $86,000–$90,000 in the short term.
“The sell-on-news pattern after recent highs is classic,” noted traders, referencing post-halving cycle dynamics. Yet the absence of a deep correction speaks volumes about underlying demand. Institutional players continue to view dips as buying opportunities.
Prediction markets like Polymarket showed strong consensus that Bitcoin would remain well above $70,000, reflecting confidence despite macroeconomic headwinds.
Read full Yahoo Finance report
Ethereum and Altcoin Movements
Ethereum (ETH) traded near $2,250–$2,280, benefiting from renewed optimism around layer-2 scaling and staking yields.

Solana (SOL), XRP, and Dogecoin (DOGE) posted selective gains of 3–5%, fueled by the CLARITY Act clearing the Senate Banking Committee in a 15-9 bipartisan vote. This landmark legislation aims to provide regulatory clarity for digital assets, potentially unlocking billions in institutional capital.
Bitcoin dominance held near 58%, suggesting selective rotation rather than a full altcoin rally. XRP and DOGE led gains amid regulatory tailwinds.
Explore CoinDesk coverage
Regulatory and Macro Tailwinds
The CLARITY Act (Digital Asset Market Clarity Act) represents a pivotal moment, advancing through Senate processes and offering much-needed regulatory certainty. Industry leaders hail it as a game-changer for mainstream adoption.
Tokenized real-world assets (RWAs), particularly U.S. Treasuries, hit a record $15 billion milestone. This boom highlights how blockchain solves liquidity and accessibility issues in traditional finance.
View RWA.xyz data
Macro factors remain mixed. Inflation data and rising yields pose headwinds, but Bitcoin’s loosening correlation with traditional markets allows it to act more as a hedge.
On-Chain and Institutional Insights
On-chain metrics remain constructive. Long-term holder supply is tightening, exchange reserves are low, and network security stays robust. Corporate adoption and venture capital inflows into blockchain infrastructure, including AI-crypto intersections, continued strongly.
Charles Schwab’s expansion into spot crypto trading exemplifies the blurring lines between TradFi and DeFi.
Learn more on CoinDesk
Risks and Outlook
Volatility remains inherent. Failure to hold $78,000–$80,000 support could trigger cascades, though strong buying interest exists at those levels. Positive catalysts include further CLARITY Act progress, Ethereum upgrades, or resuming ETF inflows. Long-term 2026 forecasts remain optimistic, with some analysts eyeing $100,000+ for Bitcoin.

The market’s ability to absorb $600M+ outflows without collapsing testifies to its evolution. Retail participation is healthy; institutions provide a stabilizing floor.
Sector Deep Dives: DeFi, NFTs, and Beyond
DeFi TVL stabilized near multi-year highs, driven by tokenized asset yields. NFTs saw selective strength in gaming and utility. Layer-1/2 competition intensified, with stablecoins maintaining dominance in global settlements.

Investor Strategies for the Current Environment
Conservative investors should dollar-cost average into BTC and ETH, allocating to tokenized Treasuries for yield.
Aggressive traders can target altcoins with regulatory tailwinds, using leverage judiciously.
Risk management — stop-losses, profit-taking at resistance, and diversification — remains essential.
Global Perspectives
Asia-Pacific markets showed resilience amid stimulus talks. Europe advanced via MiCA implementation, while Latin America and Africa drove adoption through remittances and mobile money.
Conclusion: A Market in Transition
On May 15, 2026, the crypto market proved its mettle once again. Balancing short-term volatility with regulatory progress, RWA innovation, and institutional maturation, the sector transitions toward infrastructure status. Investors focusing on fundamentals over headlines are best positioned for the upside in this transformative year.
The road to broader adoption is paved with volatility, but the destination looks increasingly inevitable. Stay informed, manage risk, and position accordingly.
Image cover is Ai generated